
Explore your point clouds
Open one or more LAS/LAZ files, control file visibility, and navigate your data with adaptive detail and height coloring.
Field notes, product updates, and mapping insights.
Explore the scan, isolate the details, and understand what you captured. Preview the desktop tools for viewing and inspecting your LiDAR data.
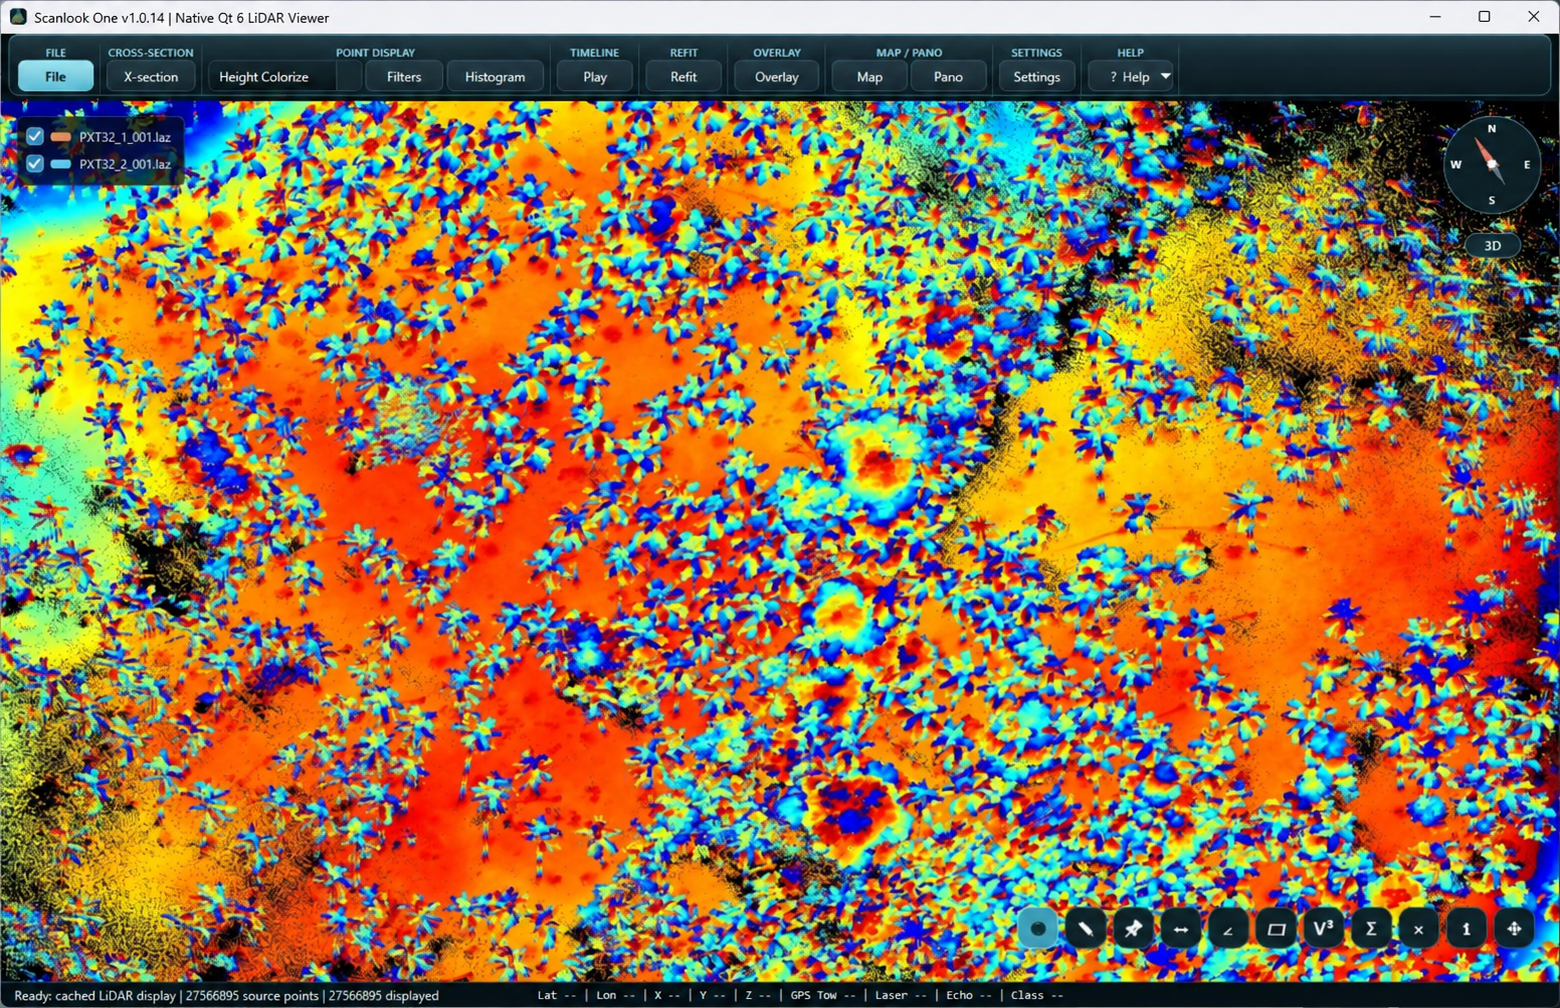
Open one or more LAS/LAZ files, control file visibility, and navigate your data with adaptive detail and height coloring.
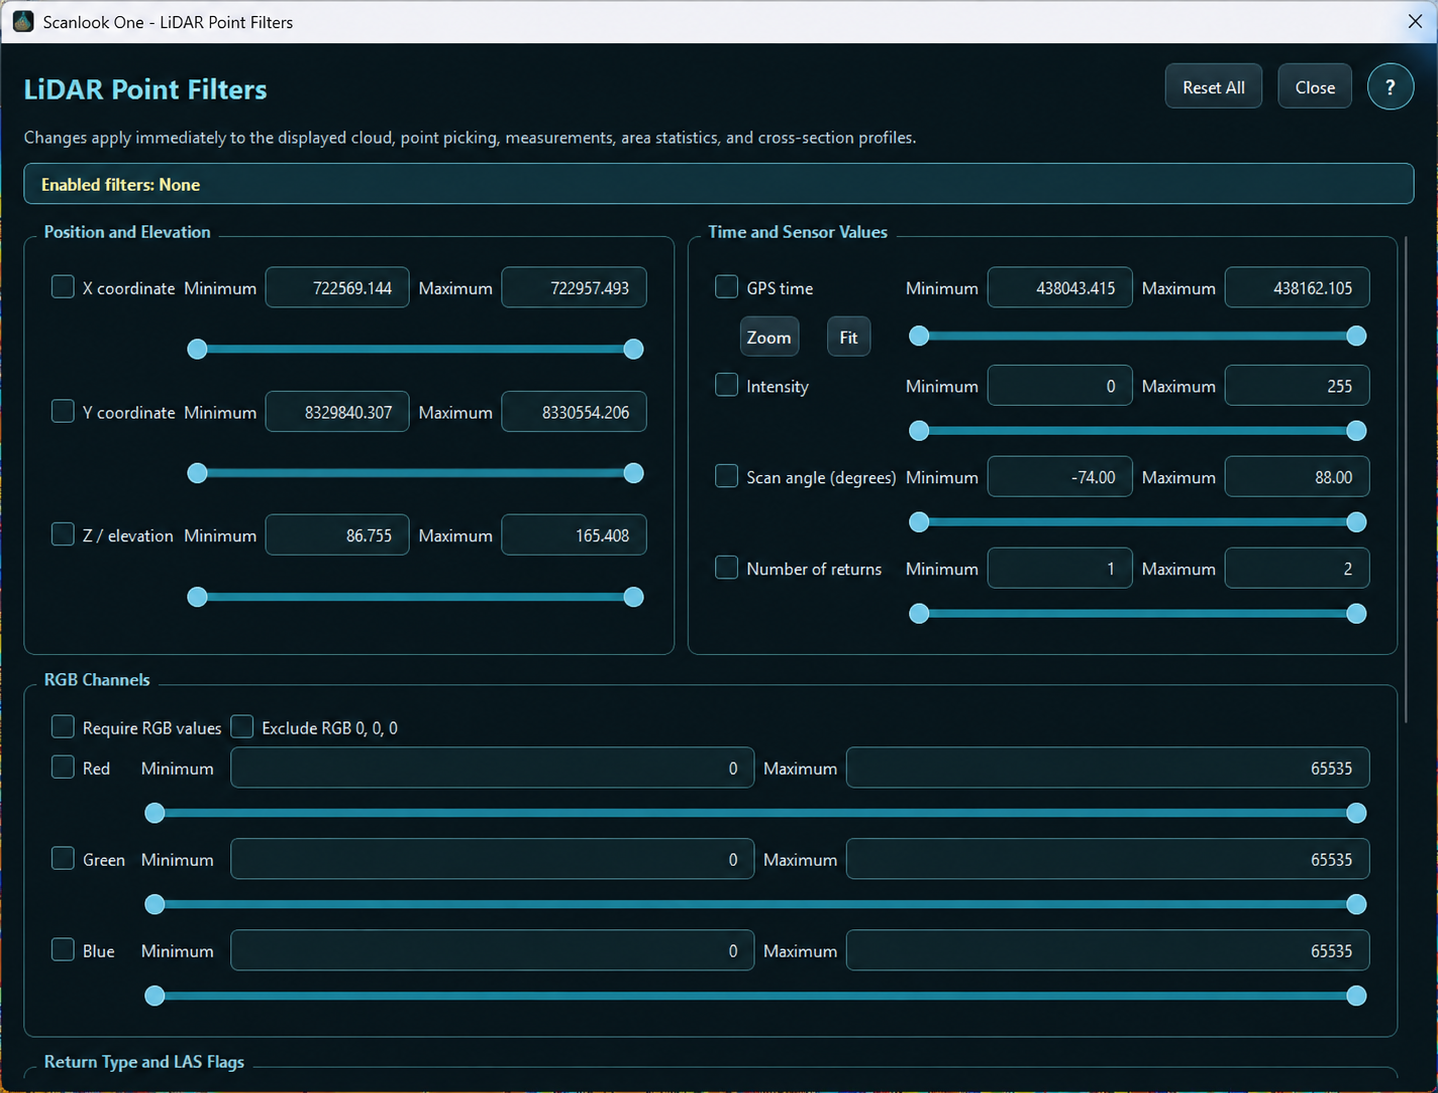
Filter by position, elevation, GPS time, intensity, scan angle, returns, classification, and laser or channel ID.
Use cross-sections to inspect profiles through the point cloud. Active point filters also apply to cross-section profiles.
Work with point picking, measurements, and area statistics to examine your data beyond the overall view.
Use map and coordinate tools alongside georeferenced imagery overlays to put your point cloud in context.
Persistent sessions, file visibility controls, and built-in help support a repeatable desktop review workflow.
Narrow the displayed cloud with range controls and point attributes. Filters apply consistently to the displayed points, point picking, measurements, area statistics, and cross-section profiles.
Available attributes depend on the data stored in your LAS/LAZ files.
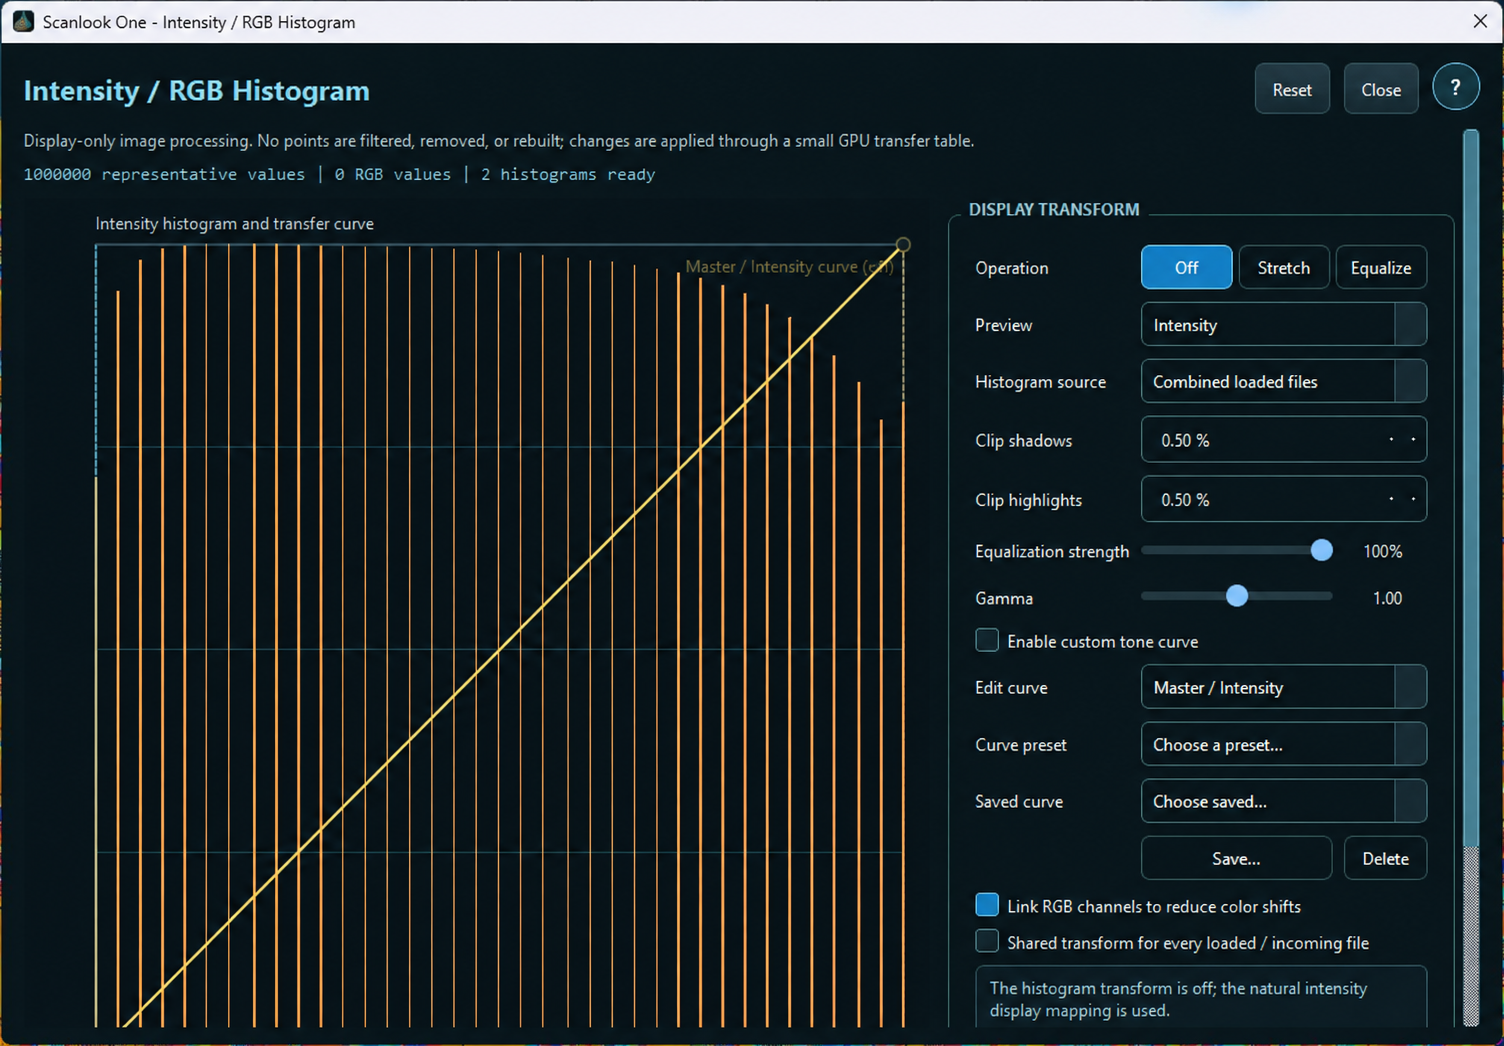
Inspect the distribution of intensity or RGB values, then adjust their display with stretch, equalization, gamma, and custom tone curves.
Histogram adjustments are display-only: they do not filter, remove, or rebuild points.
Desktop application preview with updated Scanlook One branding. Interface and features may change before release.